Fourth & Hope
HopeHub
From spreadsheets to grant-ready data
I helped translate staff research into a nonprofit CRM and designed the grant-report workflow that the team connected to Firestore and Gemini.
Watch the presentation and view the winning project on Devpost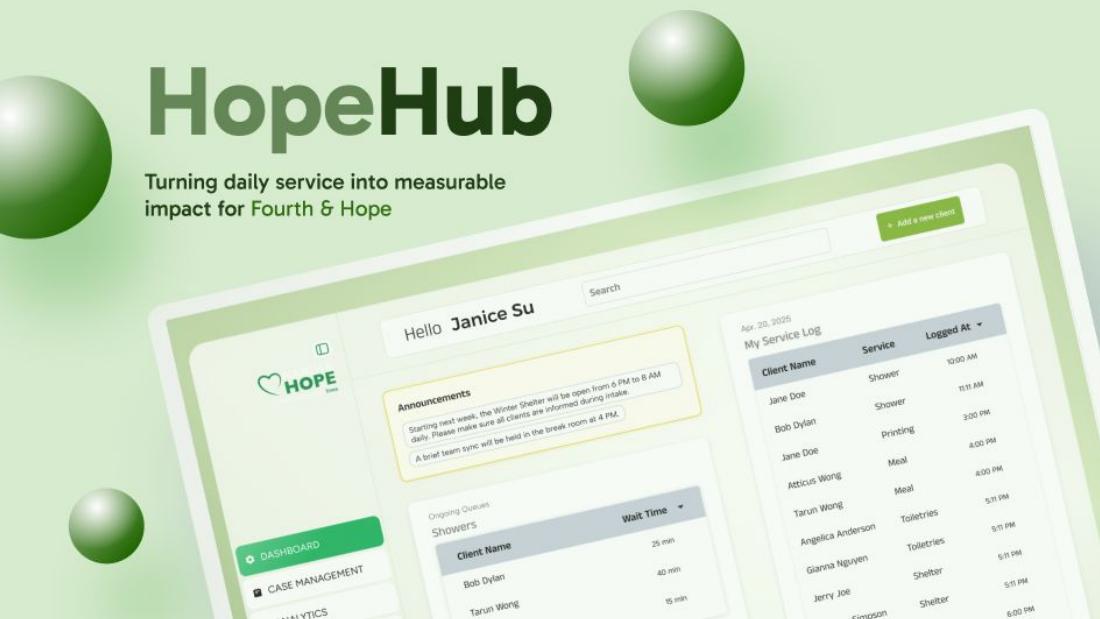
At a glance
Role, timeline, tools, and scope
Impact
One system replaced separate spreadsheets, and Fourth & Hope reported using it after the hackathon.
The reporting workflow turns the service data staff already produce into something a funder can read.
Verified project outcomes
- Adoptedteam-reported use by Fourth & Hope after the hackathon
- Real timeservice and outcome tracking through Firestore
- Awardrecognized at HackDavis 2025 (see the Devpost entry)
The challenge
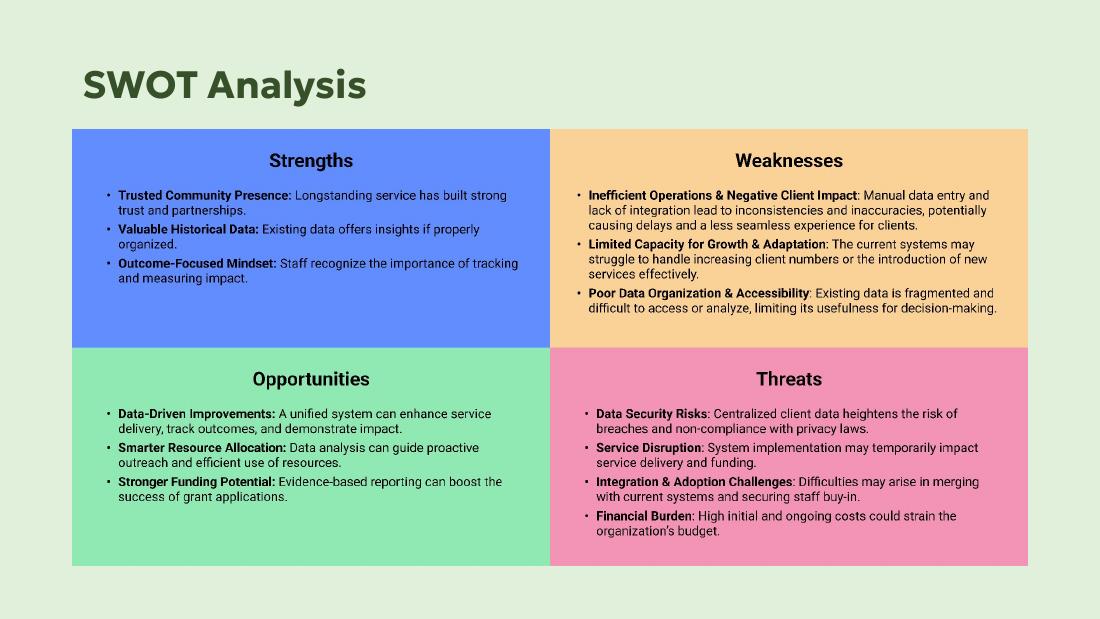
Fourth & Hope tracked showers, meals, laundry, shelter, and medication in separate spreadsheets.
Staff tracked showers, meals, laundry, shelter, and medication across separate spreadsheets. The fragmented workflow made basic coordination difficult and left leadership without measurable outcomes for funders.
An interview with staff made the need concrete: log services quickly, keep client information together, and turn the work already happening into evidence the organization could use.
Constraints
One weekend, one staff interview, and sensitive client data to protect.
This was a weekend hackathon for a real organization, which meant designing something the team could actually build in the time available while staying usable by frontline staff mid-shift.
Constraints we designed inside
- A single weekend from research to working prototype.
- One staff interview available, so the workflow had to be validated against a small evidence base.
- Centralized client data raises real privacy obligations, which shaped what the interface exposes.
- Frontline staff log services while working, so entry had to be fast and hard to get wrong.
- Any new system has to earn adoption against spreadsheets people already know.
My contribution
I turned the staff interview into the workflow, the dashboard structure, and the reporting experience.
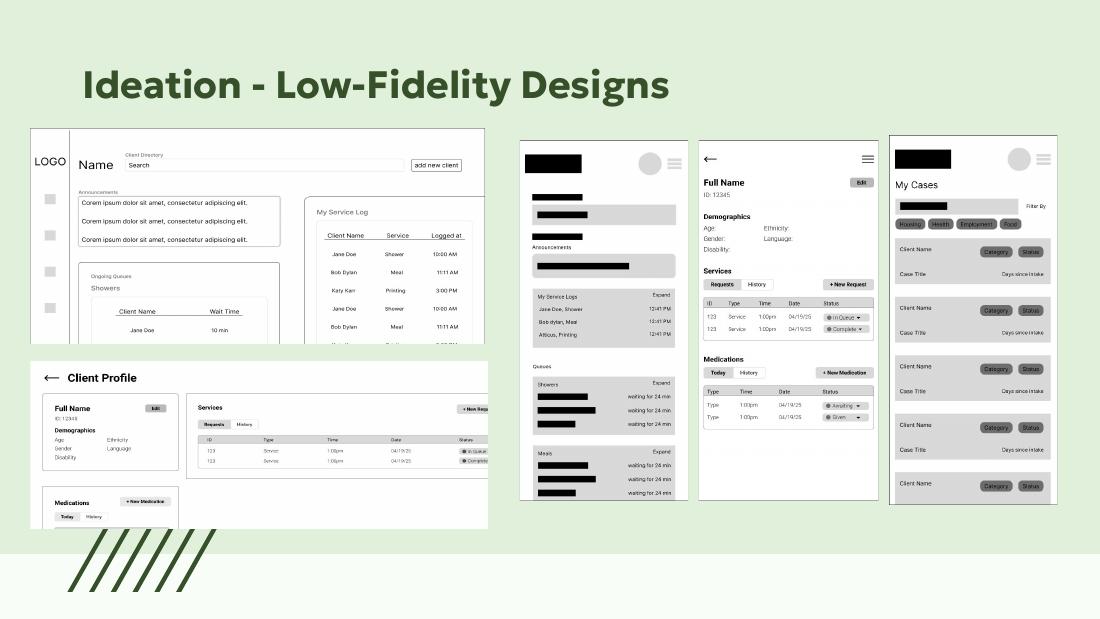
I worked across the research and design process, translating staff needs into a client directory, announcements, live service logs, and profiles that kept demographics, medication, and service history together.
I collaborated with the developers on information structure and interaction flow while they implemented the full-stack application and the Firestore data layer. I did not build the backend.
What I personally owned
- Synthesis of the staff interview into workflow requirements.
- Low-fidelity structure for the dashboard, client directory, and client profile.
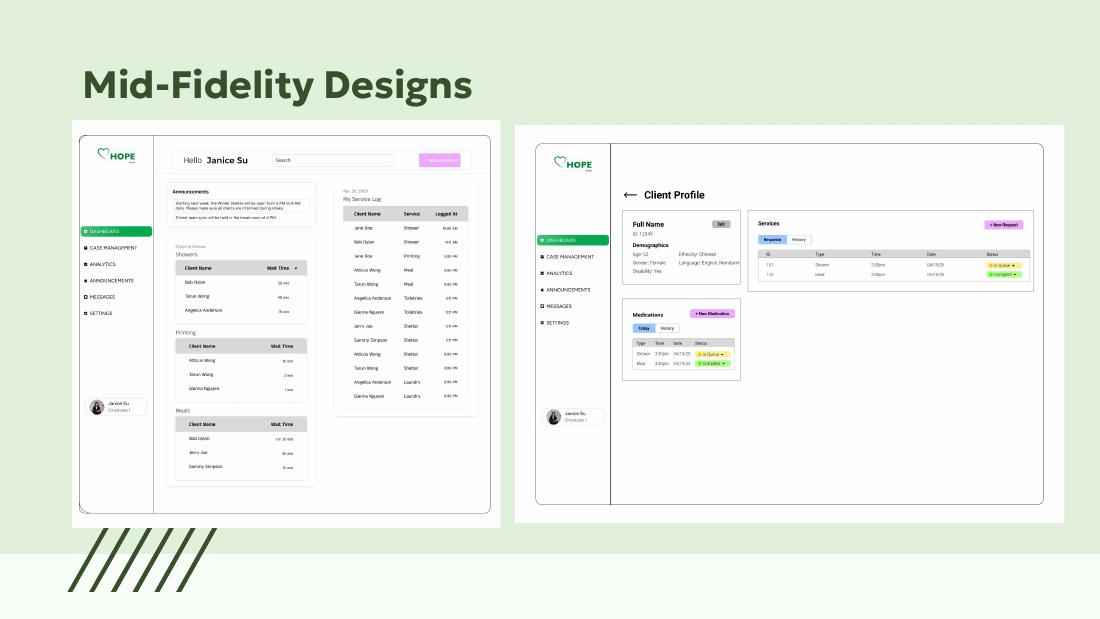
- The mid-fidelity staff dashboard with live queues and wait times.
- The information architecture for client profiles, including demographics, medication, and service history.
- The design of the grant-reporting experience and the data it needed to surface.
AI-assisted workflow
Gemini drafted report narrative from metrics the system had already recorded.
- Tool
- Gemini 2.0 Flash, via the Gemini API, integrated by the developers on the team
- Task it assisted with
- Turning structured quarterly service metrics into a first draft of a grant-report narrative.
- How output was reviewed
- The prototype sent structured Q1 metrics to Gemini 2.0 Flash, formatted the response as a grant report, compiled it to PDF, and returned it as a download for staff to read. Human review remained essential before any submission.
- Limitations
- Gemini drafted narrative text from metrics that the system had already recorded. It did not produce the metrics, run the services, or validate anything for a funder, and no generated report was submitted to one.
What I decided, designed, and verified
- I designed the reporting experience and decided what information a funder-facing report had to surface.
- I specified the structure the report needed: reach, outcomes, budget use, highlights, and next-quarter goals.
- I did not build the API integration; the developers connected the analytics workflow to the Gemini API.
- I made the case that human review had to sit between the generated draft and anything submitted.
My approach
Interview and map, frame the challenge, then set structure before visuals.
A weekend, run in four moves.
Interview and map
One staff interview, then a map of the services actually being tracked and where they lived.
Frame the challenge
Three how-might-we statements covering visibility, documentation speed, and funding evidence.
Low fidelity
Structure for the client directory, announcements, service logs, and profiles.
Mid fidelity and build
Dashboard with live queues and wait times, handed to the developers as they implemented Firestore.
Research insight
Staff already had the data; the fragmentation was what made reporting expensive.
The evidence base here was one focused staff interview plus a review of how the organization currently worked. That was enough to be specific about the workflow, and it is also the clearest limitation of the project.
What staff described was consistent: the data existed, but it was fragmented across spreadsheets, which made both coordination and reporting expensive.
What staff told us
- Showers, meals, laundry, shelter, and medication were tracked separately.
- Client information had no single home, so history was hard to reconstruct.
- Leadership could not produce measurable outcomes for funders from the existing records.
- Staff already recognized the value of tracking impact; the tooling was the obstacle.
Key decisions
Live queues on the dashboard, one client profile, and reporting as a by-product of daily logging.
Put live queues and wait times on the staff dashboard.
WhyStaff needed to see current demand at a glance to coordinate a shift, rather than only recording it afterward.
TradeoffA real-time view depends on staff logging services promptly, so the dashboard is only as current as the last entry.
Keep demographics, medication, and service history on one client profile.
WhyReconstructing a client's history across spreadsheets was the specific friction staff described.
TradeoffConsolidating sensitive information in one place increases the privacy stakes and makes access control a requirement rather than a nice-to-have.
Design reporting as an output of daily logging, not a separate task.
WhyFunders need a coherent account of reach and outcomes, while staff naturally produce service logs throughout the day.
TradeoffThe report is only as good as the day-to-day data, which puts more weight on entry quality than on the report itself.
The final concept
Service tracking and grant reporting live in the same system.
One system holds service, client, and outcome data. The staff dashboard makes current demand visible through live queues and wait times, and the client profile preserves the service history behind it.
The reporting problem went beyond displaying data. Funders need a coherent account of reach, outcomes, budget use, highlights, and next-quarter goals, while staff produce service logs throughout the day. I defined the reporting experience and the information it needed to surface.
Program highlights
- Expanded the kitchen team to provide vegetarian meal options.
- Four program graduates returned as volunteer mentors.
- Launched the Hope Garden therapy initiative with a local church.
Goals for next quarter
- Pilot a job-training workshop for shelter residents.
- Increase bed capacity by 10%.
- Implement digital intake forms for faster check-ins.
Prototype workflow: Firestore metrics → Gemini 2.0 Flash → structured LaTeX → downloadable PDF → staff review
Outcome
A working prototype shipped over one weekend and was recognized at HackDavis 2025.
The team shipped a working prototype over the weekend: a centralized CRM with real-time service tracking on Firestore and a grant-report pipeline the developers connected to the Gemini API. Fourth & Hope reported using it after the hackathon, and the project was recognized at HackDavis 2025.
Delivered
- A centralized client directory with announcements and live service logs.
- Client profiles holding demographics, medication, and service history.
- A staff dashboard with real-time queues and wait times.
- A grant-report workflow from tracked metrics to a reviewable PDF draft.
Reflection
Next time I would validate the report structure with grant staff before building it.
In a next iteration, I would validate the report structure with grant staff, test Gemini outputs against a consistent rubric, and make the human review step explicit before export.
I would also establish the component library earlier so design and development could move faster without introducing inconsistencies.